The client's own analytics, live the moment you open the page, with the AI visitors counted and a number that says whether the traffic can buy. Once a month, save the snapshot and send the client a report of what moved.
The real page: the traffic, where it comes from, the local share, the pages, and then the Flow Canvas opening. Silent, on a loop.
The whole walk · seven stops
Seven stops, from the client's analytics to a report you send every month
Here's the walk, in the order you'll do it.
1. Open Traffic Pulse
it's in the sidebar, under Intelligence
2. Connect Google Analytics
one click; pick the property
3. See the traffic, live
no run button; it's just there
4. See where it comes from
every channel, AI assistants included
5. See if it can buy
local share; the pages that leak
6. Follow one page
its whole story; how visitors move
7. Save the month, send the report
the snapshot, the verdict, the report
The client wants to know if the traffic is working.
Here's where to find out.
Step 1 · Open Traffic Pulse
It's in the sidebar, under Intelligence
Pick the client you're working on. Then open Intelligence in the left sidebar and click Traffic Pulse. The Google connection is the first card. Under it, the traffic itself, live.
1Pick the client
on the dashboard
2Open Intelligence
in the left sidebar
3Click Traffic Pulse
after Search Pulse — or its card on the dashboard
The page · top to bottom
Traffic Analysis · Live · Local · AI-awareBellhaven Design + Build
Traffic Pulse
Google Analytics connectionone consent, both pulses; the property; the events; the area
The Pulselive on open — the trend, four numbers, the window, Save Snapshot
The Flow Canvashow visitors walk the site, one page at a time
Where the traffic comes fromthe mix; channels unfold to their sources
AI Assistantscounted as a floor; then engine by engine
The Local Lenslocal share — can this traffic buy?
Where it lands — and whether it worksengagement per page, local share per page, LEAK flags
The Page Dossierone page's whole story, Search Console joined in
What it didthe events you picked, with their top channel
Snapshot Historyevery banked window, its verdict
The four buttons you'll press, in order
1Connect this client2Use this property3Save events4Save Snapshot
The sidebar · Intelligence
Intelligence
Ad Intelligence
Social Intelligence
AI Visibility Pulse
Search Pulse
Traffic Pulseclick here
SEO Pulse
Campaign Pulse
Competitor Pulse
+ Brand Research · Daily Insights · Deck Research
What's different here
Live, and there is no run button
the client's own analytics read the moment the page opens, shaped for an agency, over the window you choose.
The AI visitors, counted honestly
visits referred by AI assistants get their own row, as a floor, because the ones with no referrer hide in Direct.
It asks whether the traffic can buy
the Local Lens measures the share of visitors from the client's service area, per site and per page.
First, you connect their Google Analytics.
One click, read-only. Then the property, the events that matter, and the cities they serve.
Step 2 · Connect Google Analytics
Connect the client's Google Analytics in one click, then pick the property
Click Connect this client and approve read-only access on the Google account your agency already uses. Pick the client's Analytics property. Then two thirty-second choices: tick the events that matter, like sign-ups or calls, and tap the cities the client serves. Nothing is ever written to the client's account.
Google Analytics connectionthis client only
1
Connect
the Google account with Analytics access to the client's property
Connect this client
2
Already connected for Search Pulse?
add the Analytics permission on the same account, one click
Reconnect & add Analytics
3
Pick the property
the client's Analytics property, from the connection's list
Type it the way Google names it. Three cities in the area; the Local Lens counts sessions from these as local.
A design-build firm can only sell where its crews drive. The area is the question every traffic number gets measured against.
Observed first
the chips are the cities the site already sees, with their session counts — tapping is the fast path
Type the ones it doesn't see yet
a new local client may have no traffic from its own town yet; typed cities count the moment traffic arrives
Then you open the page, and the traffic is already there.
No run button. Four numbers and a trend line, each with its change.
Step 3 · See the traffic, live
There's no run button. Open the page and the traffic is just there
The trend line and four numbers: sessions, people, engaged sessions and the engagement rate, each with how much it changed against the month before. Pick any dates you like. Reading is free.
The PulseLIVEClient ReportSave Snapshot
WindowFrom 2026-08-07To 2026-09-06since the last snapshot · 30 days · vs the 30 days before
Aug 7sessions · engaged sessionsSep 6
Sessions
2,340+18%
Aug 7 – Sep 6
People
1,912+15%
new and returning
Engaged sessions
1,684+22%
stayed, clicked or converted
Engagement rate
72%+3 pts
site-wide, this window
The live layer
No run button
the page reads the client's analytics on open and on every window change; the live read never charges
Since the last snapshot
From is set to the day the last snapshot ended; a first look is thirty days
Window against window
every number carries its change against the equal span before it
Fresh data is provisional
same-day numbers are still settling; the page says so instead of pretending
Banking is the paid act
Save Snapshot stores the window with an AI verdict — that is the monthly ritual, in Step 7
You open a channel, and the real sources are inside it.
Every channel, the unexplained traffic explained, and the AI assistants counted.
Step 4 · See where it comes from
See where the traffic comes from, AI assistants included
One bar per channel. Click a channel and the real sources inside it open up. Traffic Google couldn't place gets explained, with the fix. And the row nobody else shows you: visits sent by AI assistants, counted as at least this many, because some arrive with no trace. Then engine by engine, with what those visitors did.
Where the traffic comes fromAug 7 – Sep 6
Organic Search1,102+31% · 640 new
Direct531+4% · 210 new
Paid Search298−12% · 240 new
Organic Social196+9% · 150 new
Referral124+2% · 60 new
Unassigned61diagnosed below
Unassigned · 61 sessionsWhy Google couldn't place these
newsletter / email-blast38medium “email-blast” isn’t one Google knowstag it utm_medium=email
qr / (not set)23the medium is missingadd utm_medium=offline to the QR link
Paid Search · 298 sessionsthe sources inside the bucket
google / cpc251campaign · kitchen-remodel-fall
bing / cpc47campaign · kitchen-remodel-fall
AI Assistantsa floor, not a ceiling
≥ 25sessions referred by AI assistants · Aug 7 – Sep 6
Counted from Google's own AI bucket plus the assistant domains we recognise. Visits that arrive with no referrer land in Direct and can't be claimed by anyone, so this reads “at least”, and means it.
Engine by engine · what those visitors did
CChatGPT≥ 14sign_up 2 · showroom_booking 1
PPerplexity≥ 6form_submit 1
GGemini≥ 3no key events
CClaude≥ 2phone_call_click 1
The other half of this story is what the assistants say about the client. That is the AI Visibility Pulse, on the same kit.
The Local Lens says whether the traffic can actually buy.
The share from the client's area, and the pages that waste it, flagged.
Step 5 · See if it can buy
Can this traffic actually become customers? And which pages waste it?
The Local Lens is one number: the share of visitors from places the client can actually serve. Under it, every landing page with its engagement and its own local share. A page that draws traffic but loses it fast is flagged LEAK. That's your fix-first list.
The Local Lensedit service area
Local share
46%+7 pts866 of 1,882 located sessions · vs the 30 days before
Bedford · Manchester · Concord in the area
Bedford · in area418
Manchester · in area326
Boston171
Concord · in area122
Nashua101
Portland50
458 sessions had no city and are not in the share. City comes from the network connection and is an estimate.
Where it lands — and whether it worksShow all 41 landing pages
sessions per landing page · engagement · local share · Aug 7 – Sep 6
/1,020eng 74% · local 41%
/services/kitchen-remodeling470eng 81% · local 63%
/blog/cost-of-a-kitchen-remodel398eng 29% · local 6%
LEAK
/portfolio224eng 77% · local 58%
/blog/kitchen-layouts176eng 33% · local 9%
LEAK
/contact92eng 88% · local 71%
Two leaks. Both blog posts draw a third of the site's landings, engage under half the site average, and almost none of it is local. That is the traffic the client hears about and the phone that never rings. The fix-first list starts here.
You open one page, and its whole story is on one card.
Who lands, what they searched, who sent them, where they go next.
Step 6 · Follow one page
Open one page and see its whole story, then watch how visitors move through the site
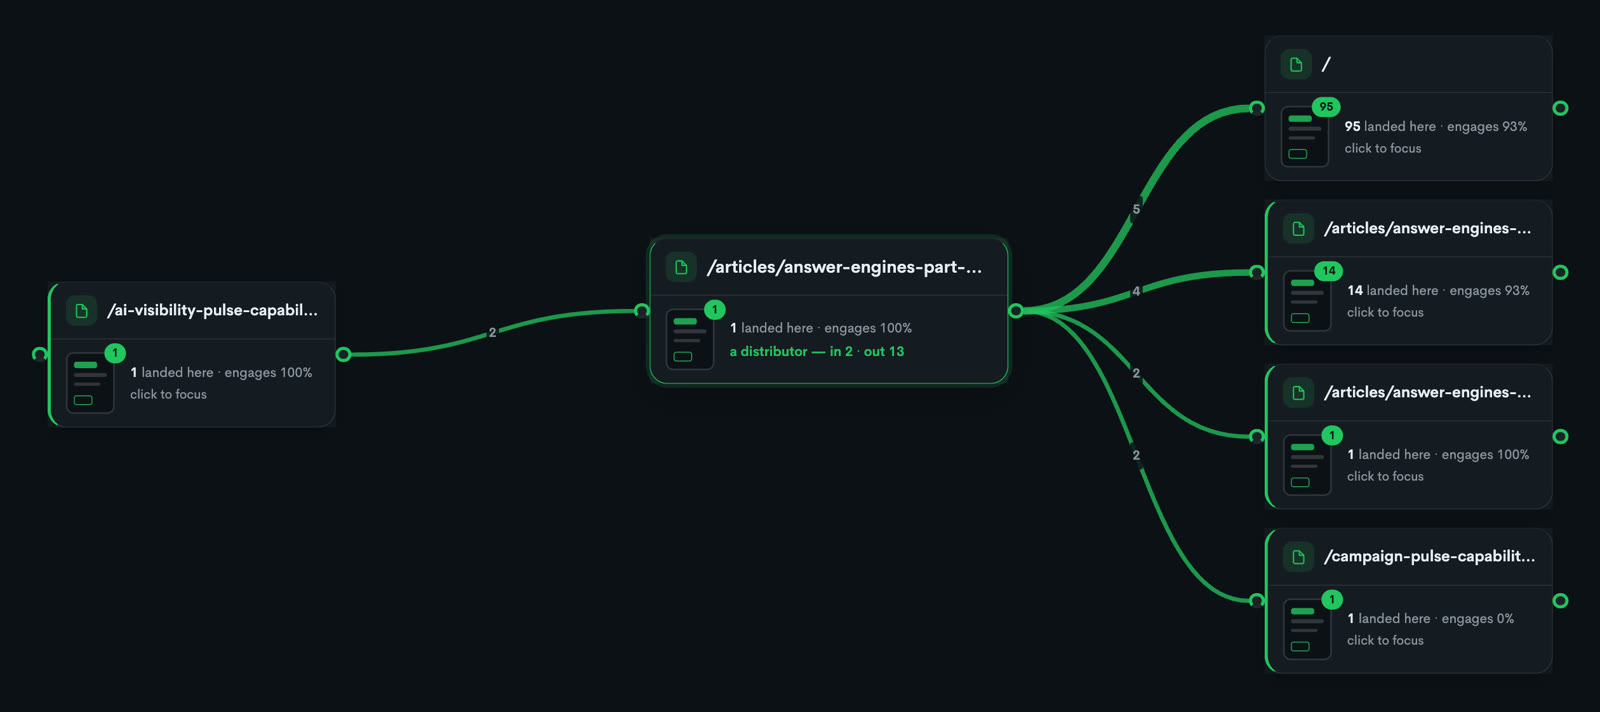
The Page Dossier puts one page's story on one card: who lands on it, the searches that bring them, who sends them, and where they go next. The Flow Canvas draws the same thing full-screen. Your page sits in the middle, visitors flow in from the left and out to the right, and you click any neighbour to follow the path.
The Flow Canvasa real capture · one page's world
The page you clicked sits in the centre with its in/out balance. Inflows fan in from the left, outflows fan out to the right, every edge carries its sessions, and each neighbour says “click to focus”.
The Page DossierAug 7 – Sep 6
/services/kitchen-remodeling470 sessions
What lands here
470 sessions+24%
engagement 81%site 72%
local share 63%in area
showroom_booking 9top event
Searches driving it
kitchen remodeling contractorspos 4.2 · 61 clicks
kitchen remodel near mepos 6.8 · 34 clicks
design build kitchenpos 3.1 · 22 clicks
from Search Consolelags ~2 days
Who sends it traffic
google / organic212
ChatGPT9
houzz-style directory7
a local news site4
How the site feeds it
from /148
from /portfolio61
to /portfolio96
to /contact74
Analytics and Search Console read on the same window, joined on the page's path. Missing rows are not zeros; Google keeps a privacy floor.
click a page in the roster and the canvas draws that page's world; it never draws the whole site
Click a neighbour to follow the path
the canvas re-centres on whatever you click, so you walk the site link by link
Same-pair links merge
three links to the same destination count as one line in this layer; the canvas says which layer it is drawing
Zero setup
built from Google's own page-to-page records; nothing to install, working on day one
A distributor or a cul-de-sac
the centre node carries its in/out balance, so a page that swallows visitors is visible at a glance
The dossier and the canvas agree
the same movement, two views — the card's in/out rows are the canvas's edges
You save the month, and send the client the report.
One click, the verdict written, and next month starts where this one ended.
Step 7 · Save the month, send the report
Save the month as a snapshot, then send the client a white-label report of what moved
Click Save Snapshot and the month is kept, with a two-sentence verdict written for the client. Click Client Report, tick the chapters you want, and Save as PDF. Next month, start where this one ended. The movement between snapshots is the story you tell.
Bellhaven Design + Build — Traffic Pulse Report (Aug 7 – Sep 6, 2026)DownloadSave as PDF
Traffic grew eighteen percent over the window, driven by a thirty-one percent rise in organic search, and the local share of visitors climbed to forty-six percent. Two blog posts draw a third of the landings and almost none of it is local; showroom bookings rose with the traffic, and the AI assistants sent at least twenty-five visits, two of which signed up.
2,340
sessions
72%
engaged
46%
local
≥25
AI visits
Where it lands · LEAK · /blog/cost-of-a-kitchen-remodel · 398 sessions · engagement 29% · local 6% …
Snapshot HistorySave Snapshot
Sep 6, 2026 · Aug 7 – Sep 6
sessions · engaged · local · AI floor: 2,340 · 72% · 46% · ≥25
View
Aug 7, 2026 · Jul 8 – Aug 7
sessions · engaged · local · AI floor: 1,980 · 69% · 39% · ≥14
View
Jul 8, 2026 · Jun 8 – Jul 8
sessions · engaged · local · AI floor: 1,760 · 66% · 35% · ≥9
View
Next month
From is already set to Sep 6. Three snapshots in, the local share has climbed 35 → 39 → 46 and the AI floor 9 → 14 → 25. That movement is the client-progress story nothing else can tell.
The verdict is written for the client
two confident sentences a CEO reads first, grounded in the window's numbers
The actions page detaches
Recommended Actions prints as the final sheet — keep it as the proposal, or drop it
A link the client can open
the report also arrives as a link that needs no login, live for seven days
Or you just ask Claude.
It reads the traffic, saves the snapshot, and hands back the report.
Or · Say it to Claude
Or just ask Claude
Ask what the traffic is doing. Claude reads it live, answers your question first, saves the snapshot when you say so, and hands you the report link. Four playbooks do the asking for you.
“Read Bellhaven's traffic — did the fall campaign move showroom bookings, and how local is the traffic? Then bank the snapshot and give me the client report link.”
runs it
your question answered first → the full read → the snapshot banked → the live link → the verdict → the report link
Traffic pulse setup
check the connection, the permission and the property; point you at the page for the rest
Traffic pulse read
the live traffic read like an analyst — channels opened, AI engines, dossiers, flow, leaks
Traffic pulse snapshot
resolve the window, bank it, hand back the live link and the verdict
Traffic pulse report
build the client report and hand back the link
Good to know
Today's numbers are still settling. Google finalises traffic after about a day, and the page says so.
The AI number is a floor. Some visits from AI assistants arrive with no trace, so the count reads “at least” and means it.
City is an estimate. Visitors with no city are left out of the local share, and the page says how many.
Read-only, always. Nothing is ever written to the client's account, and disconnecting removes the credential.
The video at the top and the Flow Canvas in Step 6 are real captures. Every other figure on this page is drawn for a fictional client.
The walk loops — next month's snapshot starts where this one ended, and the movement between them is the story.